
Dragon Eye Trading Suite is a comprehensive trading platform delivering professional-grade analytics—comparable to market maker tools—in a clear, accessible format suitable for traders and enthusiasts of all levels. Its core logic has been rigorously verified using AI across diverse assets and multiple markets. This guide will walk you through how to read and use it effectively.
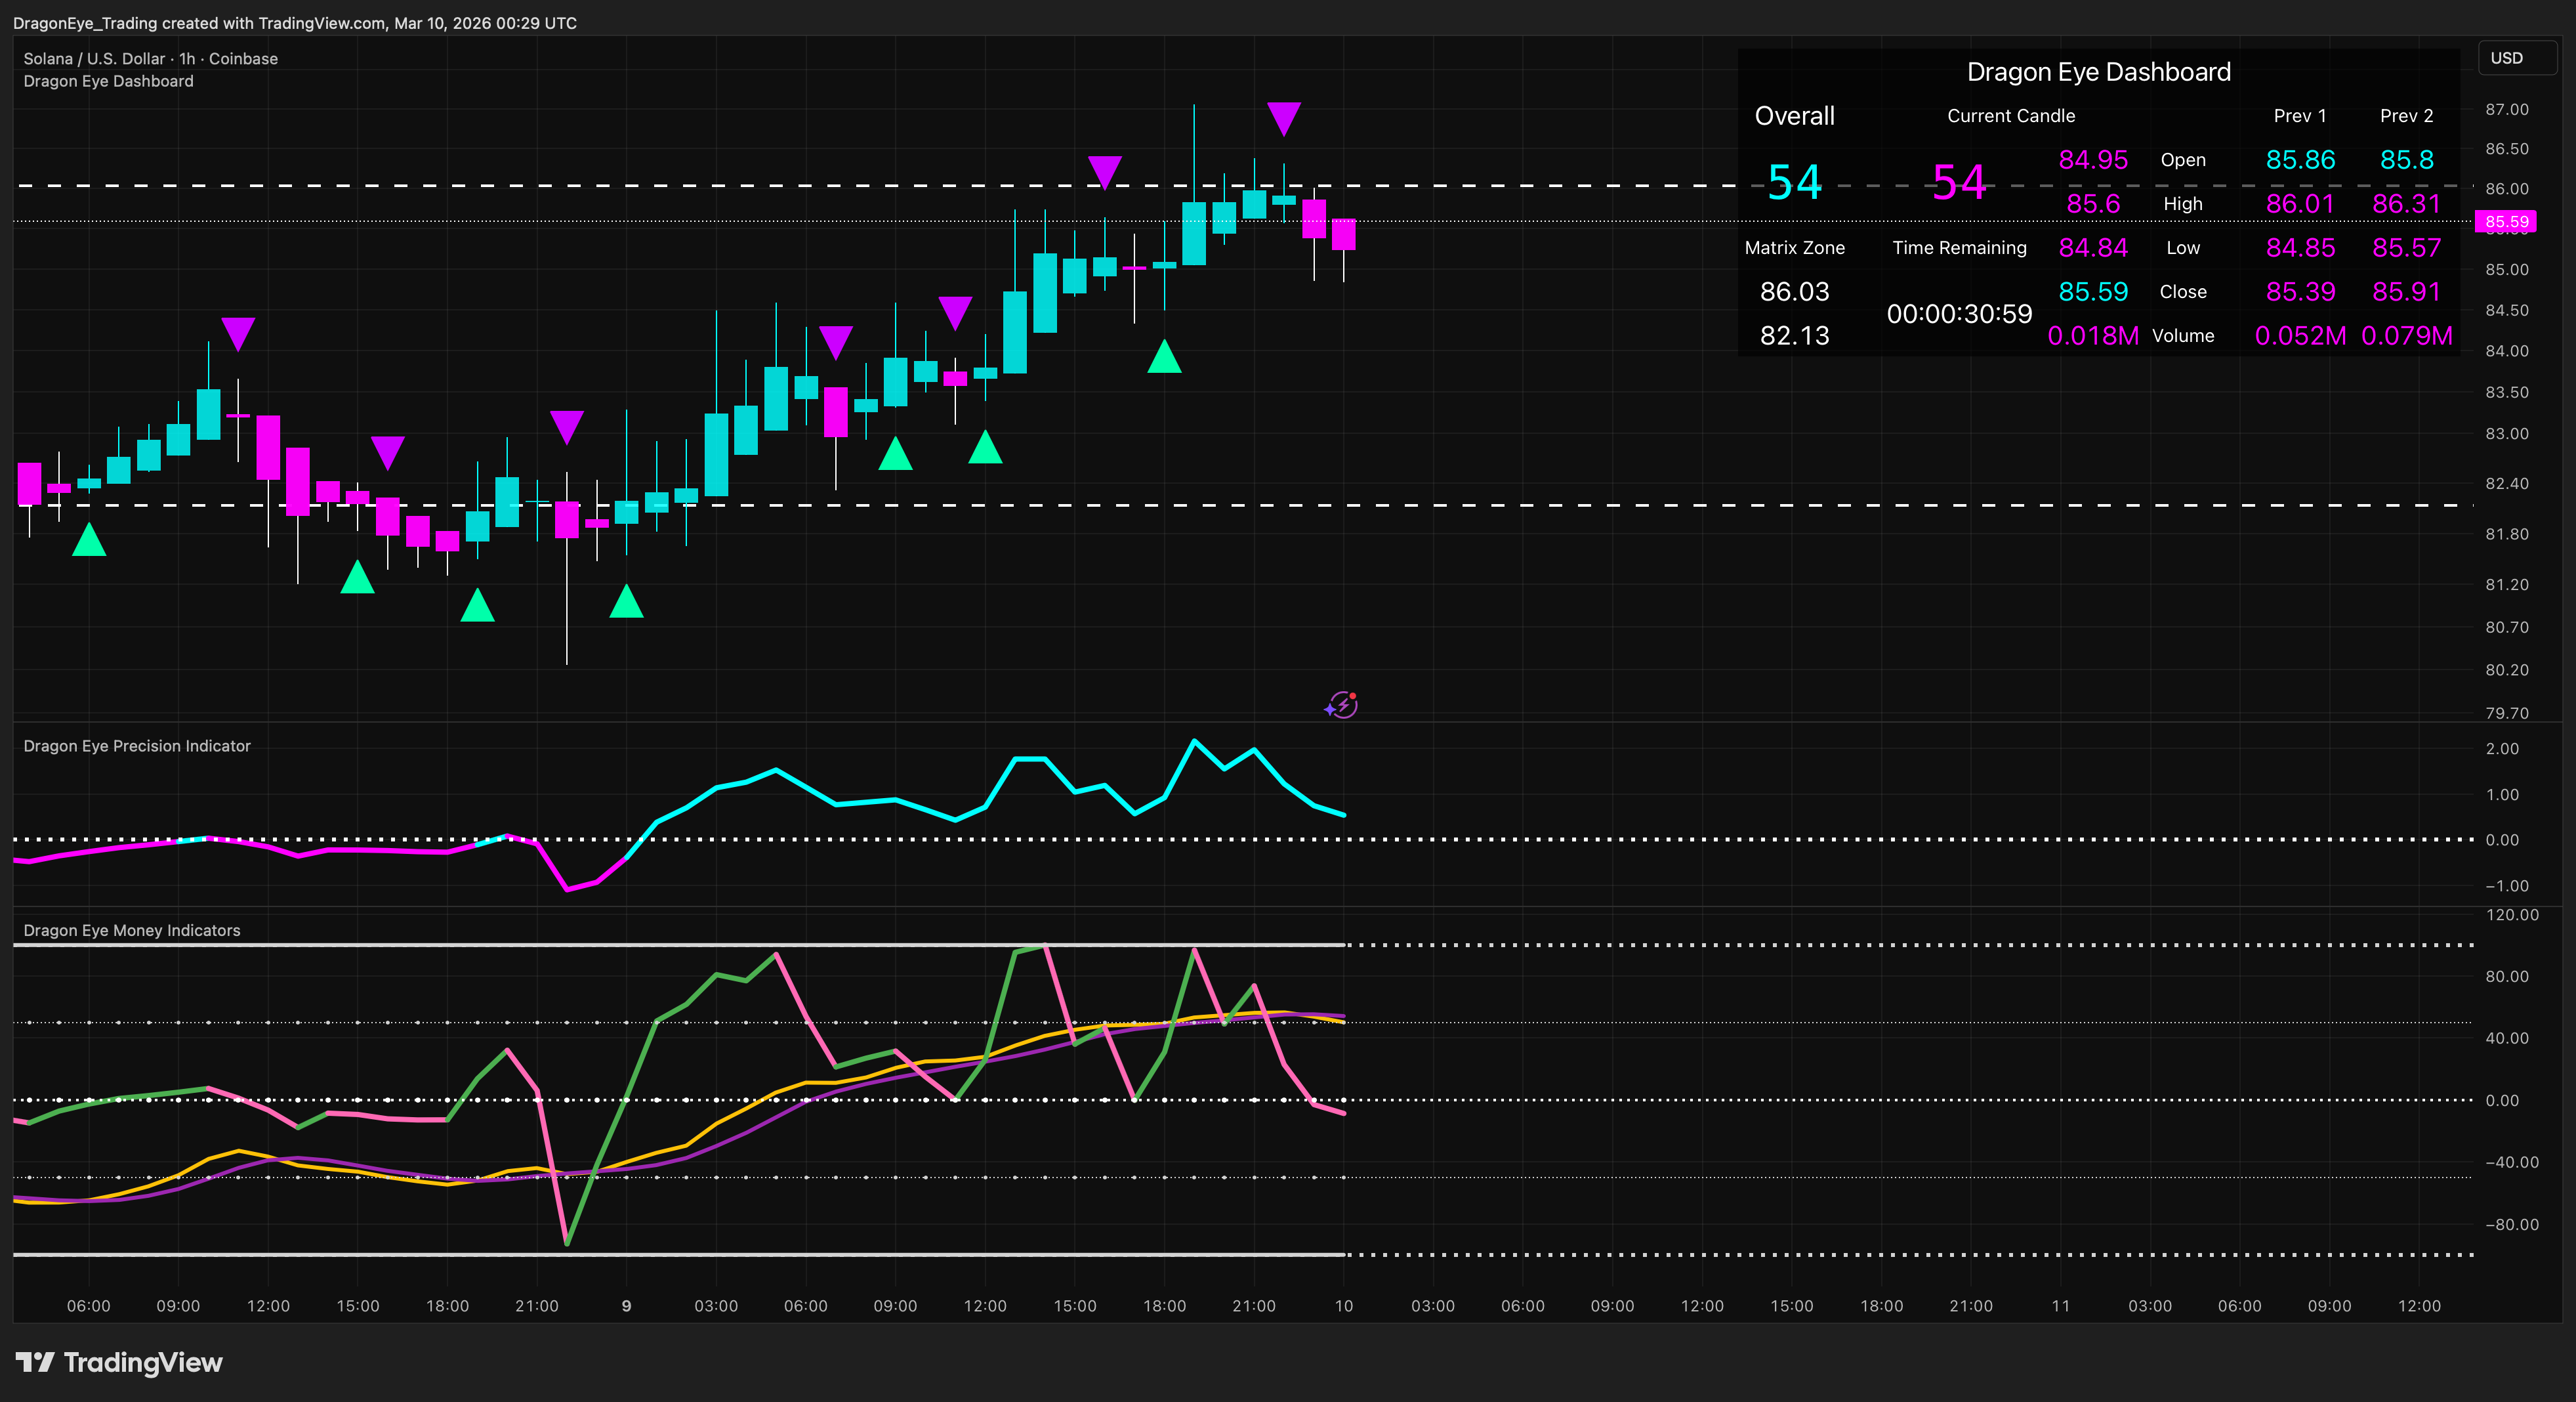
The Dragon Eye Precision Indicator is the centerpiece of the Dragon Eye Trading Suite. It serves as the primary source for determining the overall bull or bear trend.

The Dragon Eye Money Indicators accurately measure strength and momentum.

The Dragon Eye Money Indicators pane features five horizontal reference lines, each named for its precise role in measuring money strength and momentum.
• Bull/Bear Line(center): Divides bullish territory (above) from bearish territory (below).
• Big Money In Line: Signals strong buying pressure in bullish territory.
• Top Line: Marks topped-out conditions in the bullish zone.
• Big Money Out Line: Signals strong selling pressure in bearish territory.
• Bottom Line: Marks bottomed-out conditions in the bearish zone.
All lines—including the Top and Bottom—can be crossed. On larger moves, the outer lines may be temporarily breached. This is normal behavior and why they're selectable for alerts (e.g., "Topped Out" or "Bottomed Out").
These lines form the foundation for reading the MSI and Price Wave Lines.
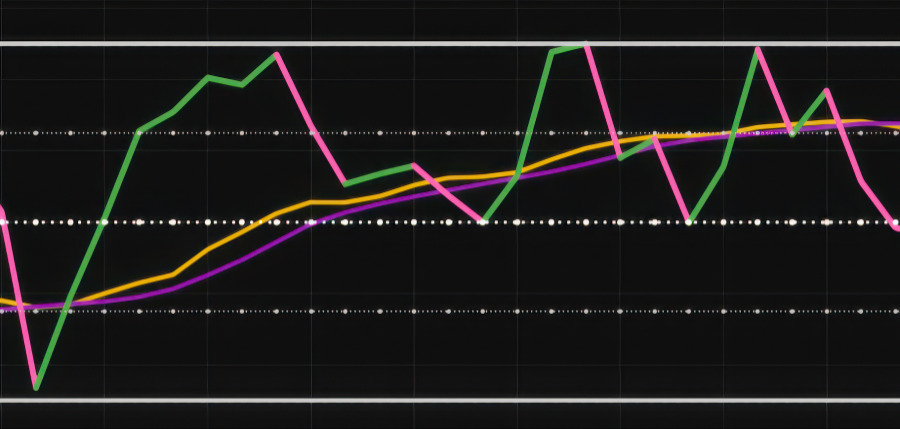
The Dragon Eye Money Strength Indicator accurately measures money strength.
How to Read It
The MSI displays money strength through color, position, and direction relative to the horizontal reference lines:
• Color — green indicates bullish money strength, pink indicates bearish money strength
• Position — where the line sits relative to the Bull/Bear Line and the Big Money In / Big Money Out Lines shows the current territory and strength
• Direction — the slope and movement of the line reveal whether money strength is building or fading
Reading the MSI in relation to the horizontal reference lines provides a clear picture of money strength that works together with the Price Wave Lines.
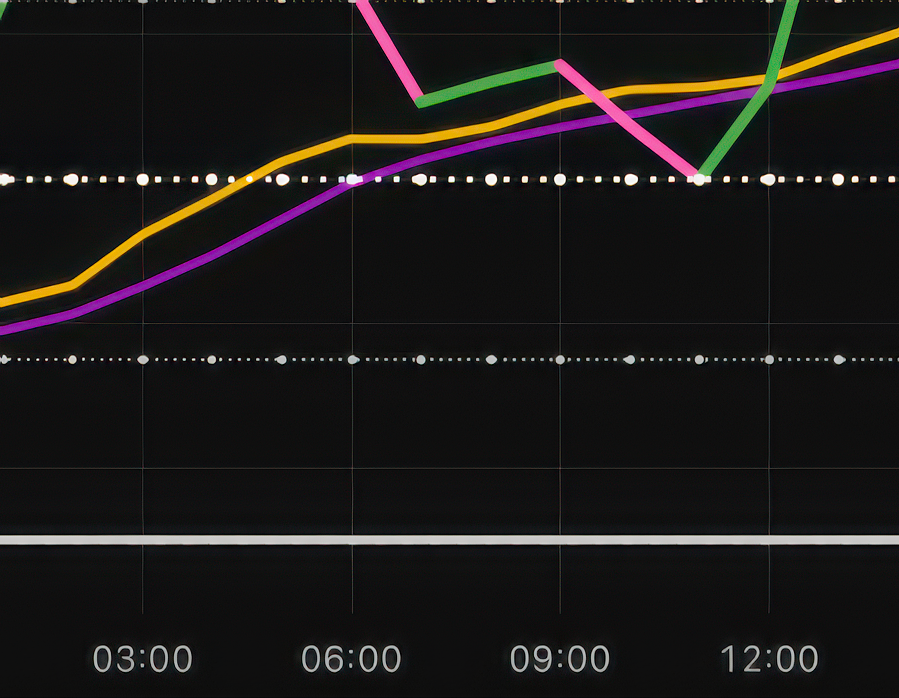
The Dragon Eye Price Wave Lines precisely track money momentum.
How to Read It
The Price Wave Lines consist of a slow momentum line (purple) and a fast momentum line (yellow) that are read based on crossings, position relative to the horizontal reference lines, direction, and territory.
• Crossings — when the fast line crosses above or below the slow line indicates directional momentum shifts
• Position — where the slow and fast lines sit in relation to the Bull/Bear Line and the Big Money In / Big Money Out Lines indicates strength
• Direction — whether the lines are rising or falling reveals the current momentum trend
• Territory — position above or below the Bull/Bear Line confirms bullish or bearish territory, just like the MSI
Reading the slow and fast Price Wave Lines together provides a clear picture of money momentum that works in conjunction with the MSI.
The Dragon Eye Dashboard provides a quick-reference overview of asset health and real-time insights.
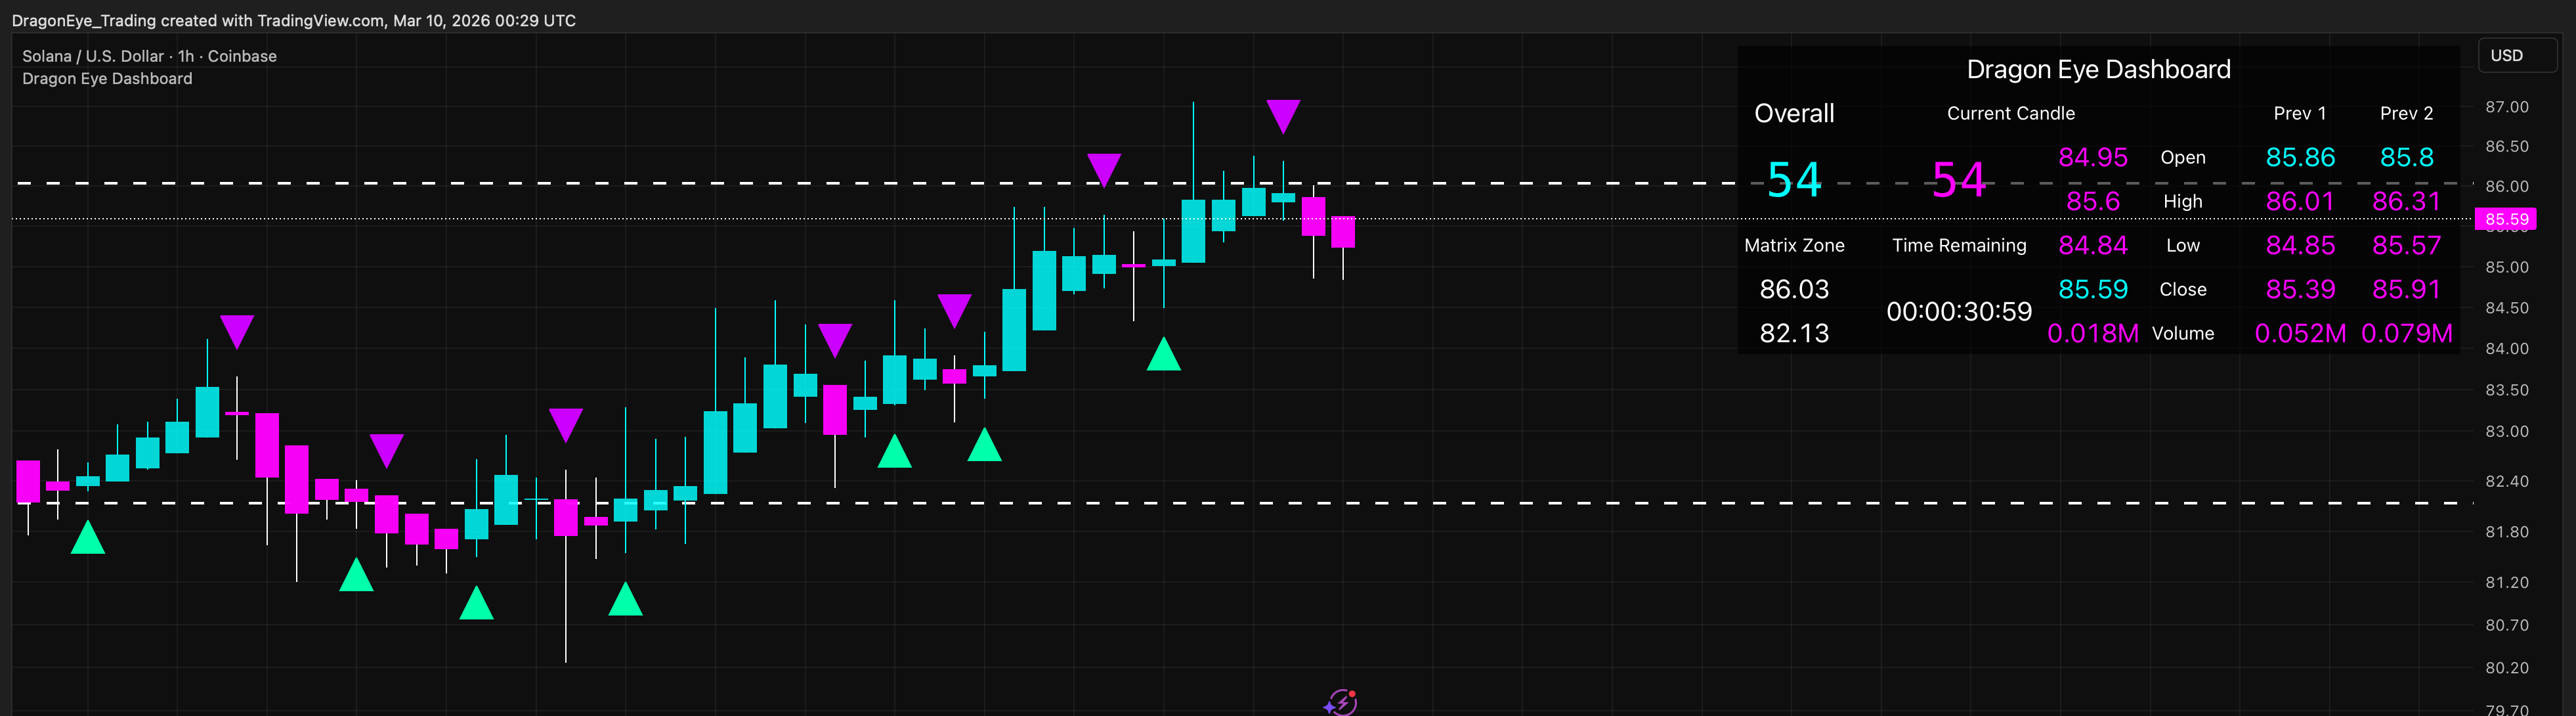
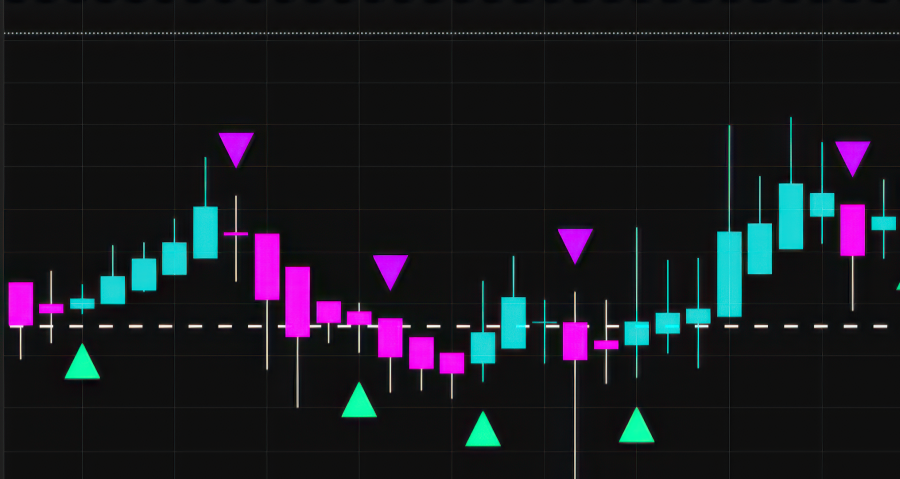
Pulse Markers are visual signals that appear on the chart to indicate momentum shifts.
How to Read It
• Upward facing cyan triangles — below the price bars indicate bullish momentum shifts
• Downward facing magenta triangles — above the price bars indicate bearish momentum shifts
These markers show the timing and direction of momentum changes, but they do not indicate the strength of the move.
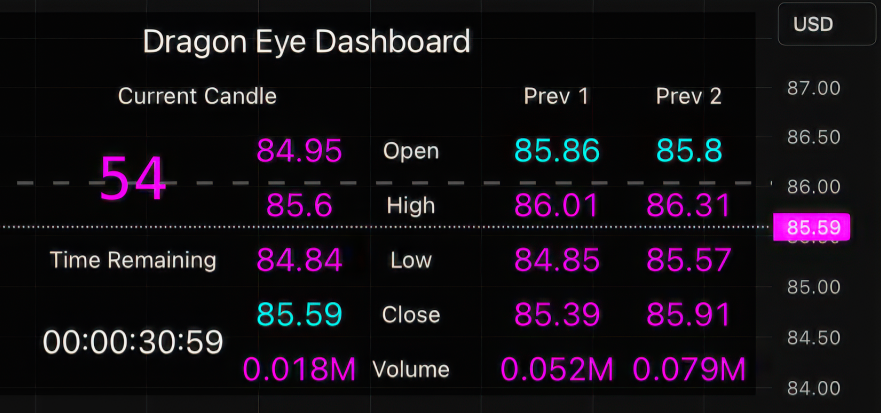
The Dragon Eye OHLCV is a quick-reference display with color logic for timely analysis.
How to Read It
The OHLCV section shows live data for the current candle and the previous two candles with color-coded directional logic. (cyan = bullish, magenta = bearish).
• Current Candle — its color is determined by comparison to Prev 1.
• Prev 1 — its color is determined by comparison to Prev 2.
• Prev 2 — retains the color it had when it was previously Prev 1.
This creates a quick visual chain of momentum direction across the last three candles.
• Volume is standardized to millions for consistent comparison across any asset.
• Time Remaining — countdown to the close of the current candle for precise timing.
Note: Displays “Market Closed” when non 24/7 markets are closed.
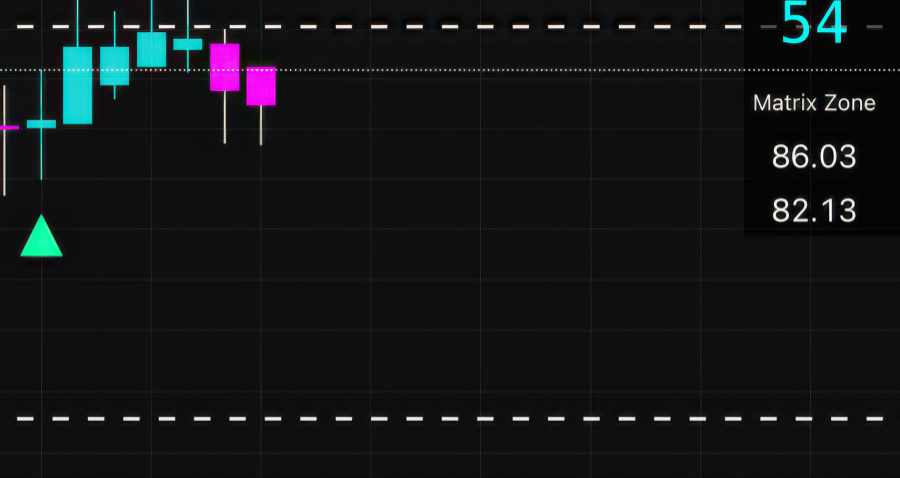
The Dragon Eye Matrix Zone Rays provide accurate support and resistance levels derived from pulse logic.
How to Read It
The Matrix Zone Rays are forward-projected support and resistance levels displayed on both the dashboard and the chart.
• Dashboard Display — shows the nearest support level (below current price) and resistance level (above current price)
• Confluence Count — when multiple rays align at the same level, a confluence number appears to indicate stronger alignment
• On-Chart Lines — when price is within 7% of a ray, a horizontal line appears on the chart and extends back 54 candles from the current price for clear visual reference
These rays give a forward-looking view of key support and resistance zones that work together with the rest of the suite.

The Dragon Eye Score provides a real-time bull/bear assessment in one number.
How to Read It
The Dragon Eye Score is a single number that provides a dynamic, real-time assessment of overall market bias. The color of the number itself indicates direction and strength:
• At 50.00 — the score appears gray (neutral)
• Above 50 — the score turns cyan and increases toward 100 (bullish)
• Below 50 — the score turns magenta and decreases toward 100 (bearish)
The farther the score moves from 50 in either direction, the stronger the bull or bear bias.
This score is calculated from the combined logic of the entire suite and serves as a quick, at-a-glance reference for market direction.
The Current Score reflects the timeframe your chart is set to, while the Overall Score is derived from 9 weighted timeframes.
Want to see the suite in action? View real examples from the Dragon Eye Trading Suite.
The Dragon Eye Trading Suite and all information on this website are for educational purposes only and do not constitute financial or investment advice. Trading involves substantial risk, including the potential loss of all capital. Past performance is not indicative of future results. The suite is provided "as is" and results may vary. You are solely responsible for your trading decisions. See our Terms of Service for full details.