

The following real-market examples demonstrate how the Dragon Eye Precision indicator, Dragon Eye Money Indicators, and Dragon Eye Dashboard align to identify potential opportunities across multiple asset classes and market conditions:
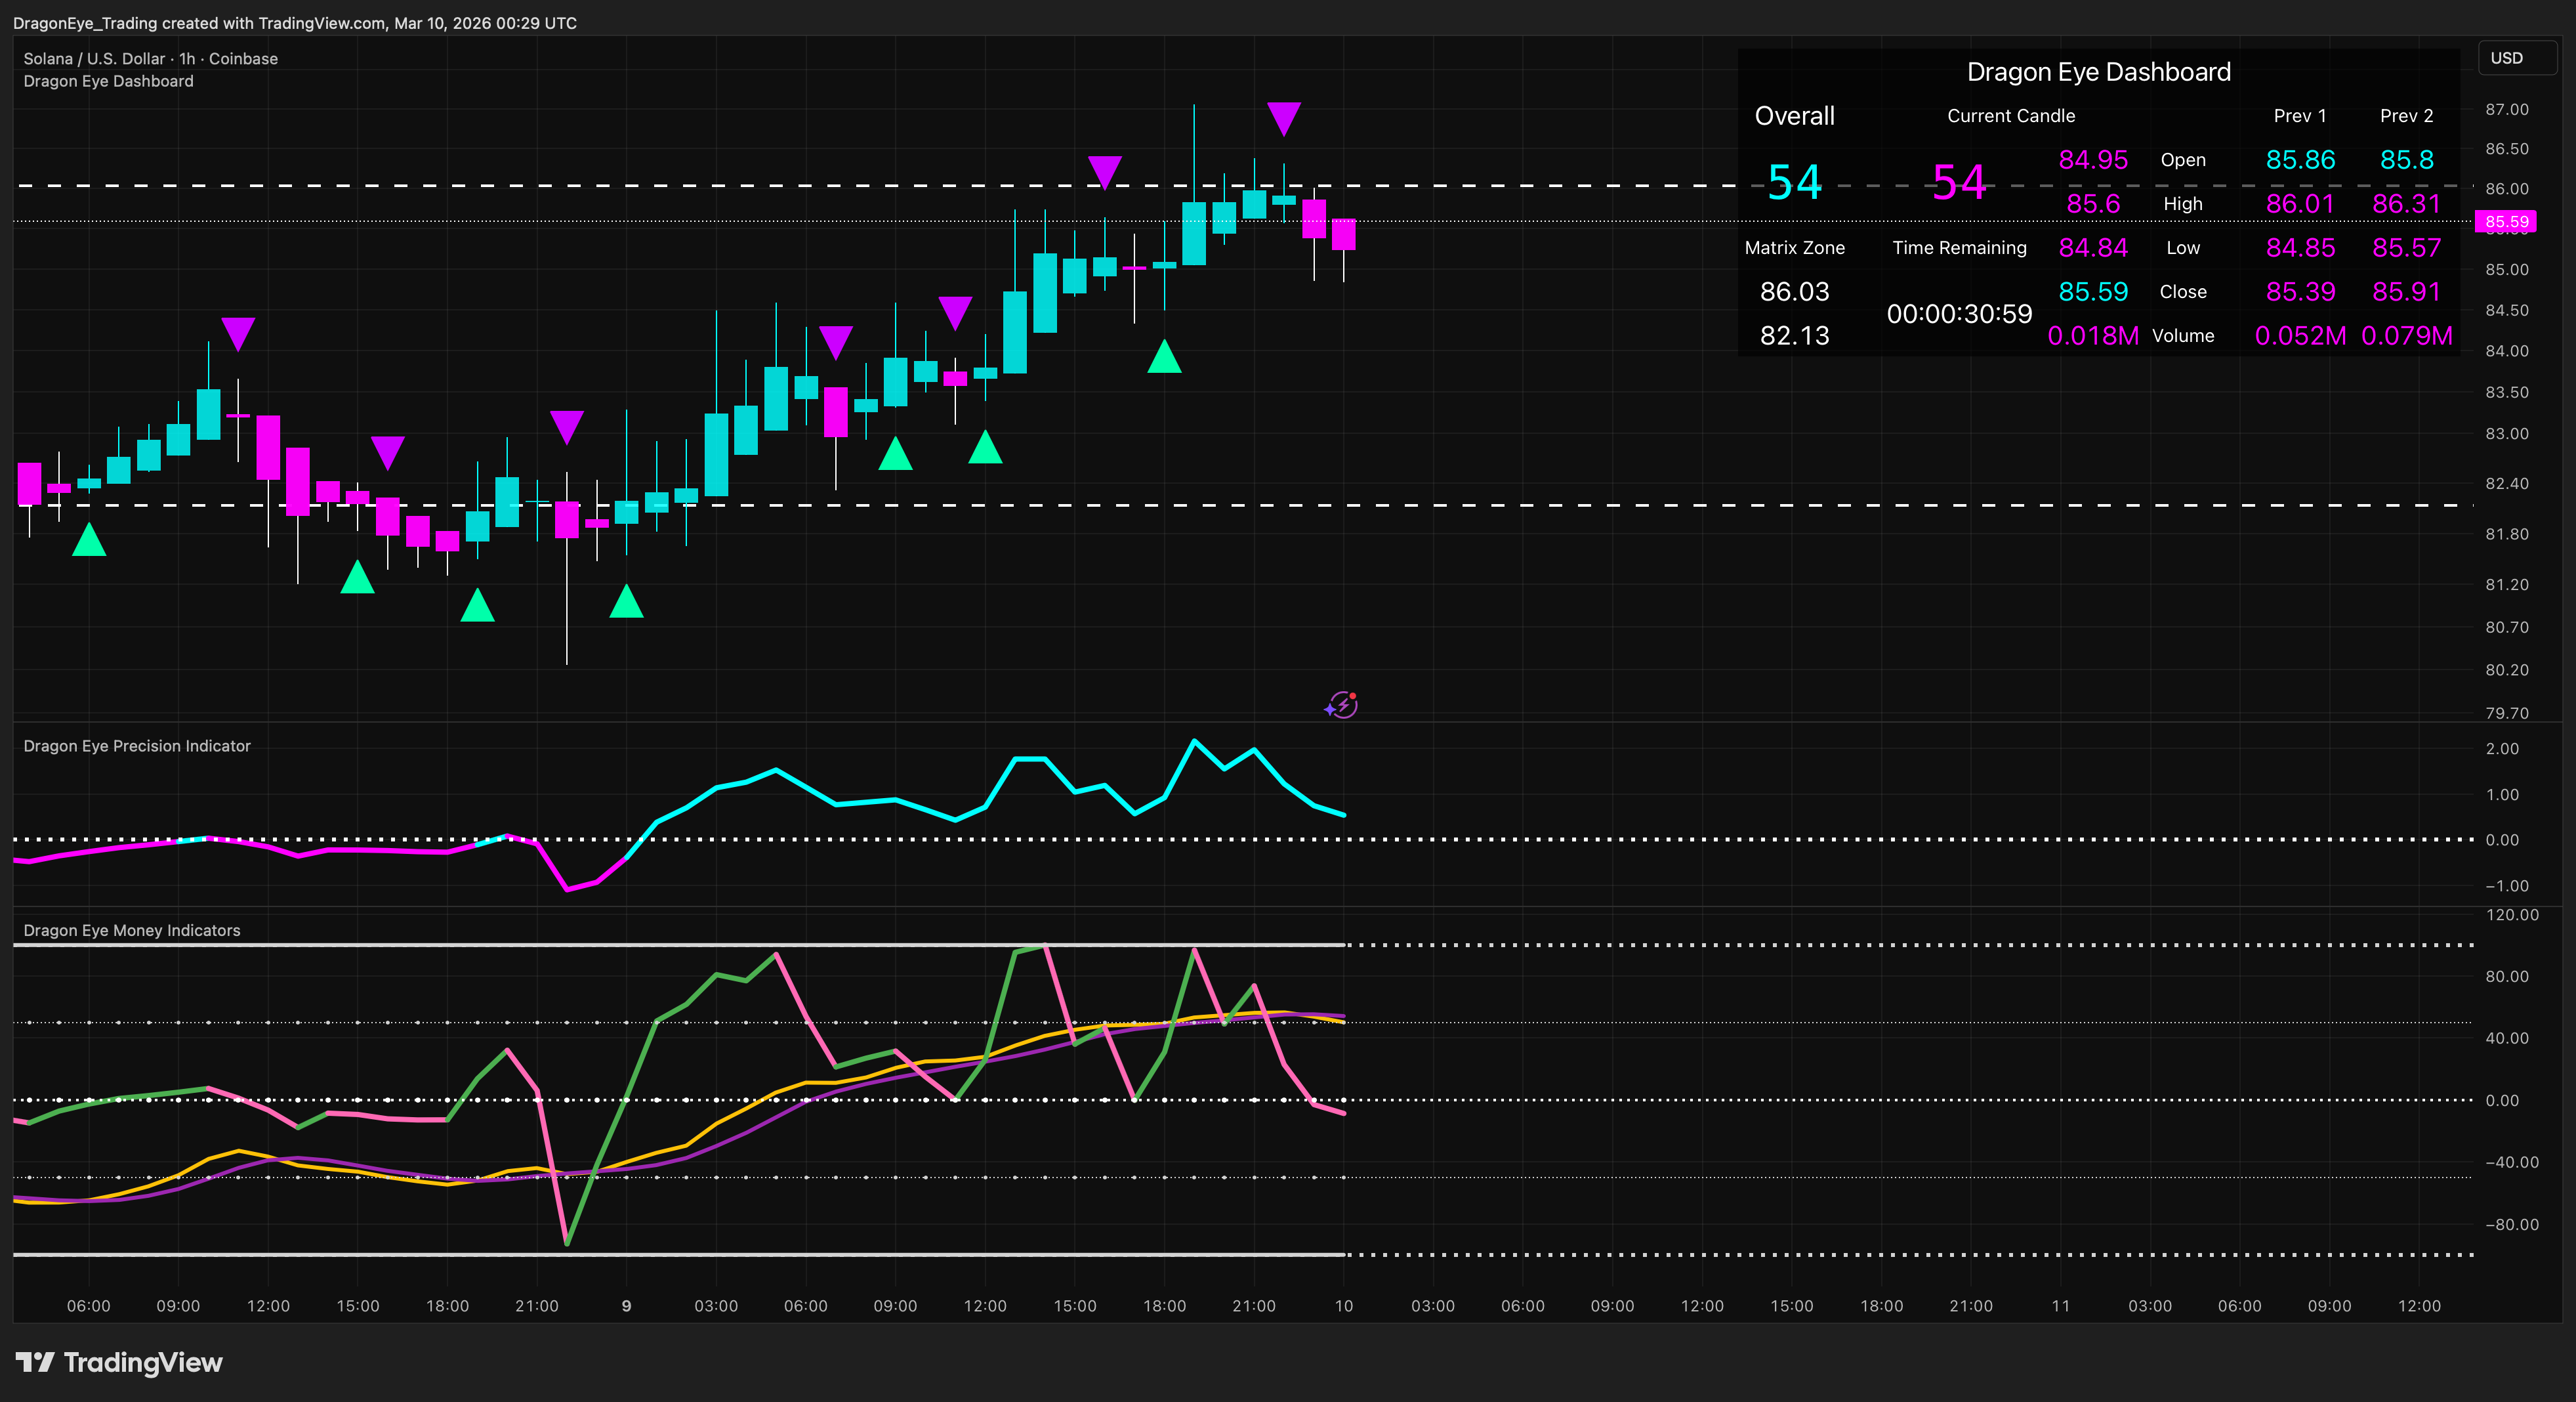
In this SOLUSD 1-hour chart, the Dragon Eye Suite displayed clear bullish alignment across all components. The chart illustrates how the Precision Indicator, Money Indicators, and Dashboard worked together to highlight a potential opportunity between two Matrix Zone Rays.

Prior to the breakout, the Precision Indicator tested the Bull/Bear Line multiple times, repeatedly crossing above and below it. It was not sustained above the Bull/Bear Line until the final move higher began. As the Precision Indicator aligned with the other components of the suite, the cyan line moved decisively above the Bull/Bear Line, showed a strong upward slope, and maintained increasing distance from the Bull/Bear Line, confirming the bullish shift.

Prior to the move, the MSI tested lower levels while pink (bearish). It then flipped from pink to green (bullish) and showed a noticeable upward slope, confirming strong buying pressure and aligning with the Precision Indicator.
The Price Wave Lines provided final confirmation when the fast yellow momentum line crossed above the slow purple momentum line, signaling the acceleration of bullish momentum before the real move higher occurred.
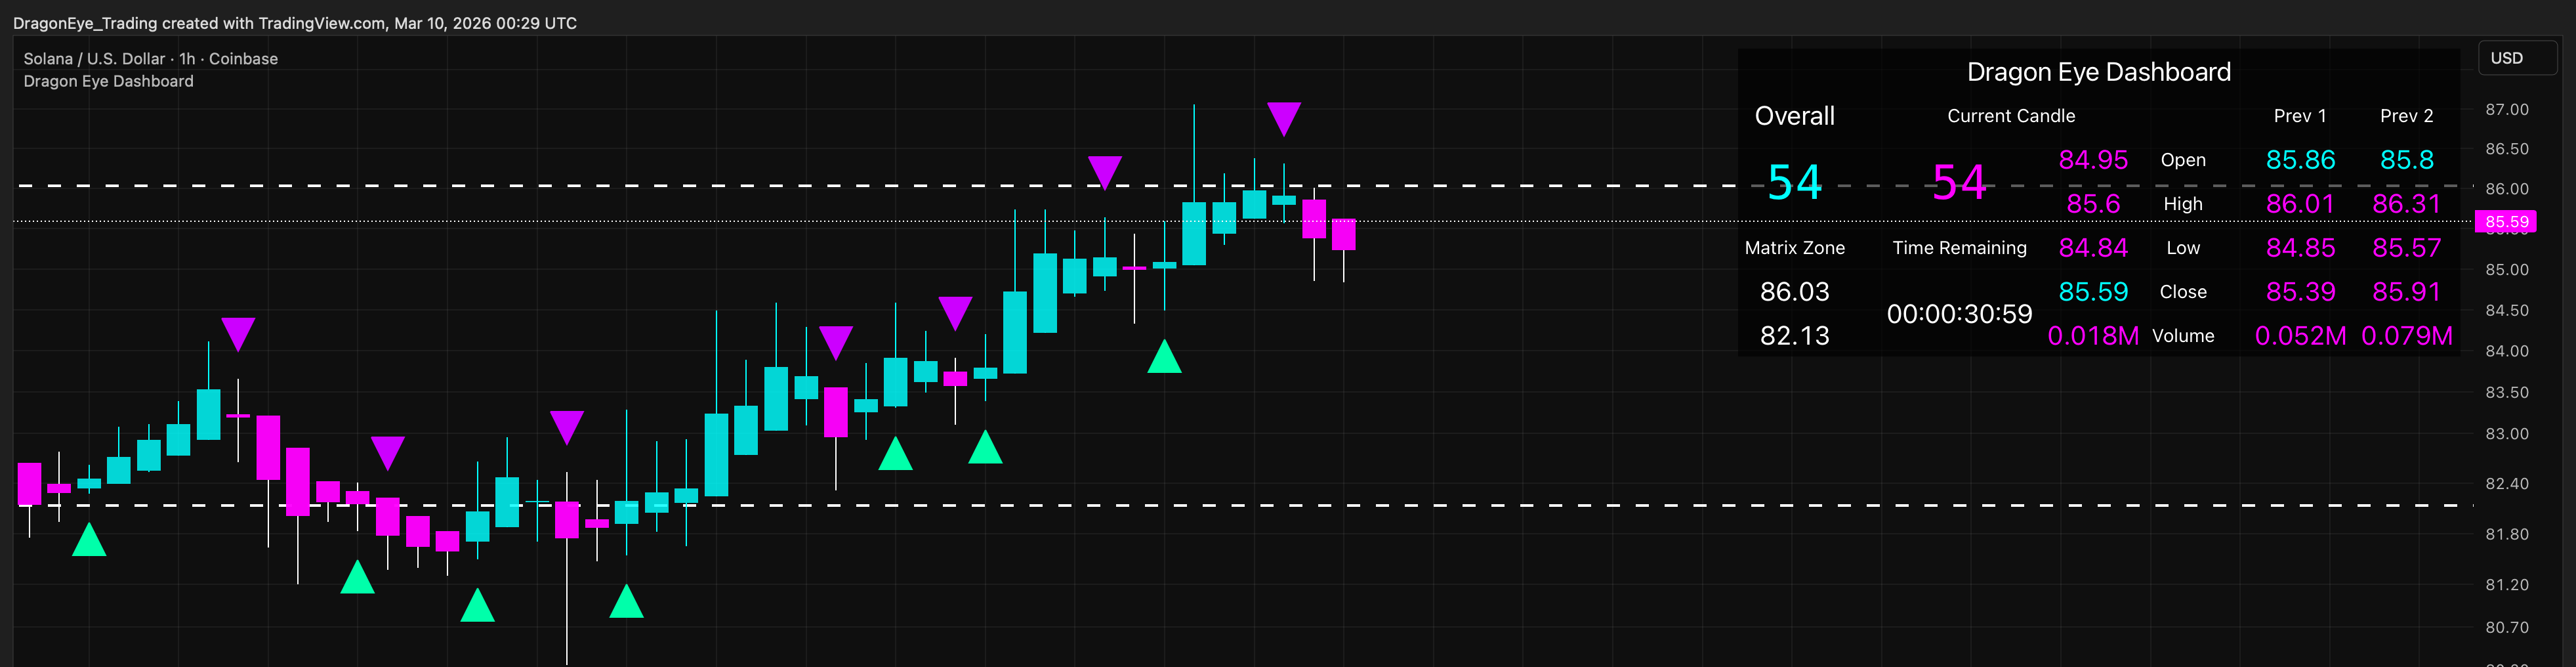
Prior to the breakout, the Pulse Markers helped identify each failed test of the Bull/Bear Line resistance. At each test, a downward facing magenta triangle appeared before rejecting. As the final move higher developed, an upward facing cyan triangle appeared. This cyan triangle provided early confirmation of the bullish shift, occurring just before the Precision Indicator moved decisively bullish.
The OHLCV section would have allowed traders to monitor price action and volume momentum in real time alongside the other indicators. The color-coded directional logic across the current and previous two candles provided a clear visual chain of momentum as the setup developed. This helped confirm the sustained bullish move and aligned with the Precision Indicator and Money Indicators.
The Matrix Zone Rays clearly defined the trade boundaries. Price was testing the lower MZR at the same time the Precision Indicator was testing the Bull/Bear Line. Once the alignment across the suite strengthened, price broke through the lower Matrix Zone Ray. After the breakout, this level flipped from resistance to support. As price continued higher, it approached the upper Matrix Zone Ray, which acted as the next resistance level and potential target.
The Dragon Eye Scores helped monitor the bullish trend in both the current candle and the overall market bias. Throughout the setup, the Overall Score remained above 50 and was cyan, while the Current Candle Score continued rising and turned cyan. As the move developed, the rising Current Candle Score provided a single-number confirmation that aligned with the Precision Indicator, Money Indicators, and Matrix Zone Rays.
In this SOLUSD example, the Dragon Eye Suite showed consistent bullish alignment across all components. The price ultimately rose approximately 4.75% from the entry zone between the two Matrix Zone Rays, demonstrating how the Precision Indicator, Money Indicators, Dashboard, and Score worked together to highlight the opportunity.
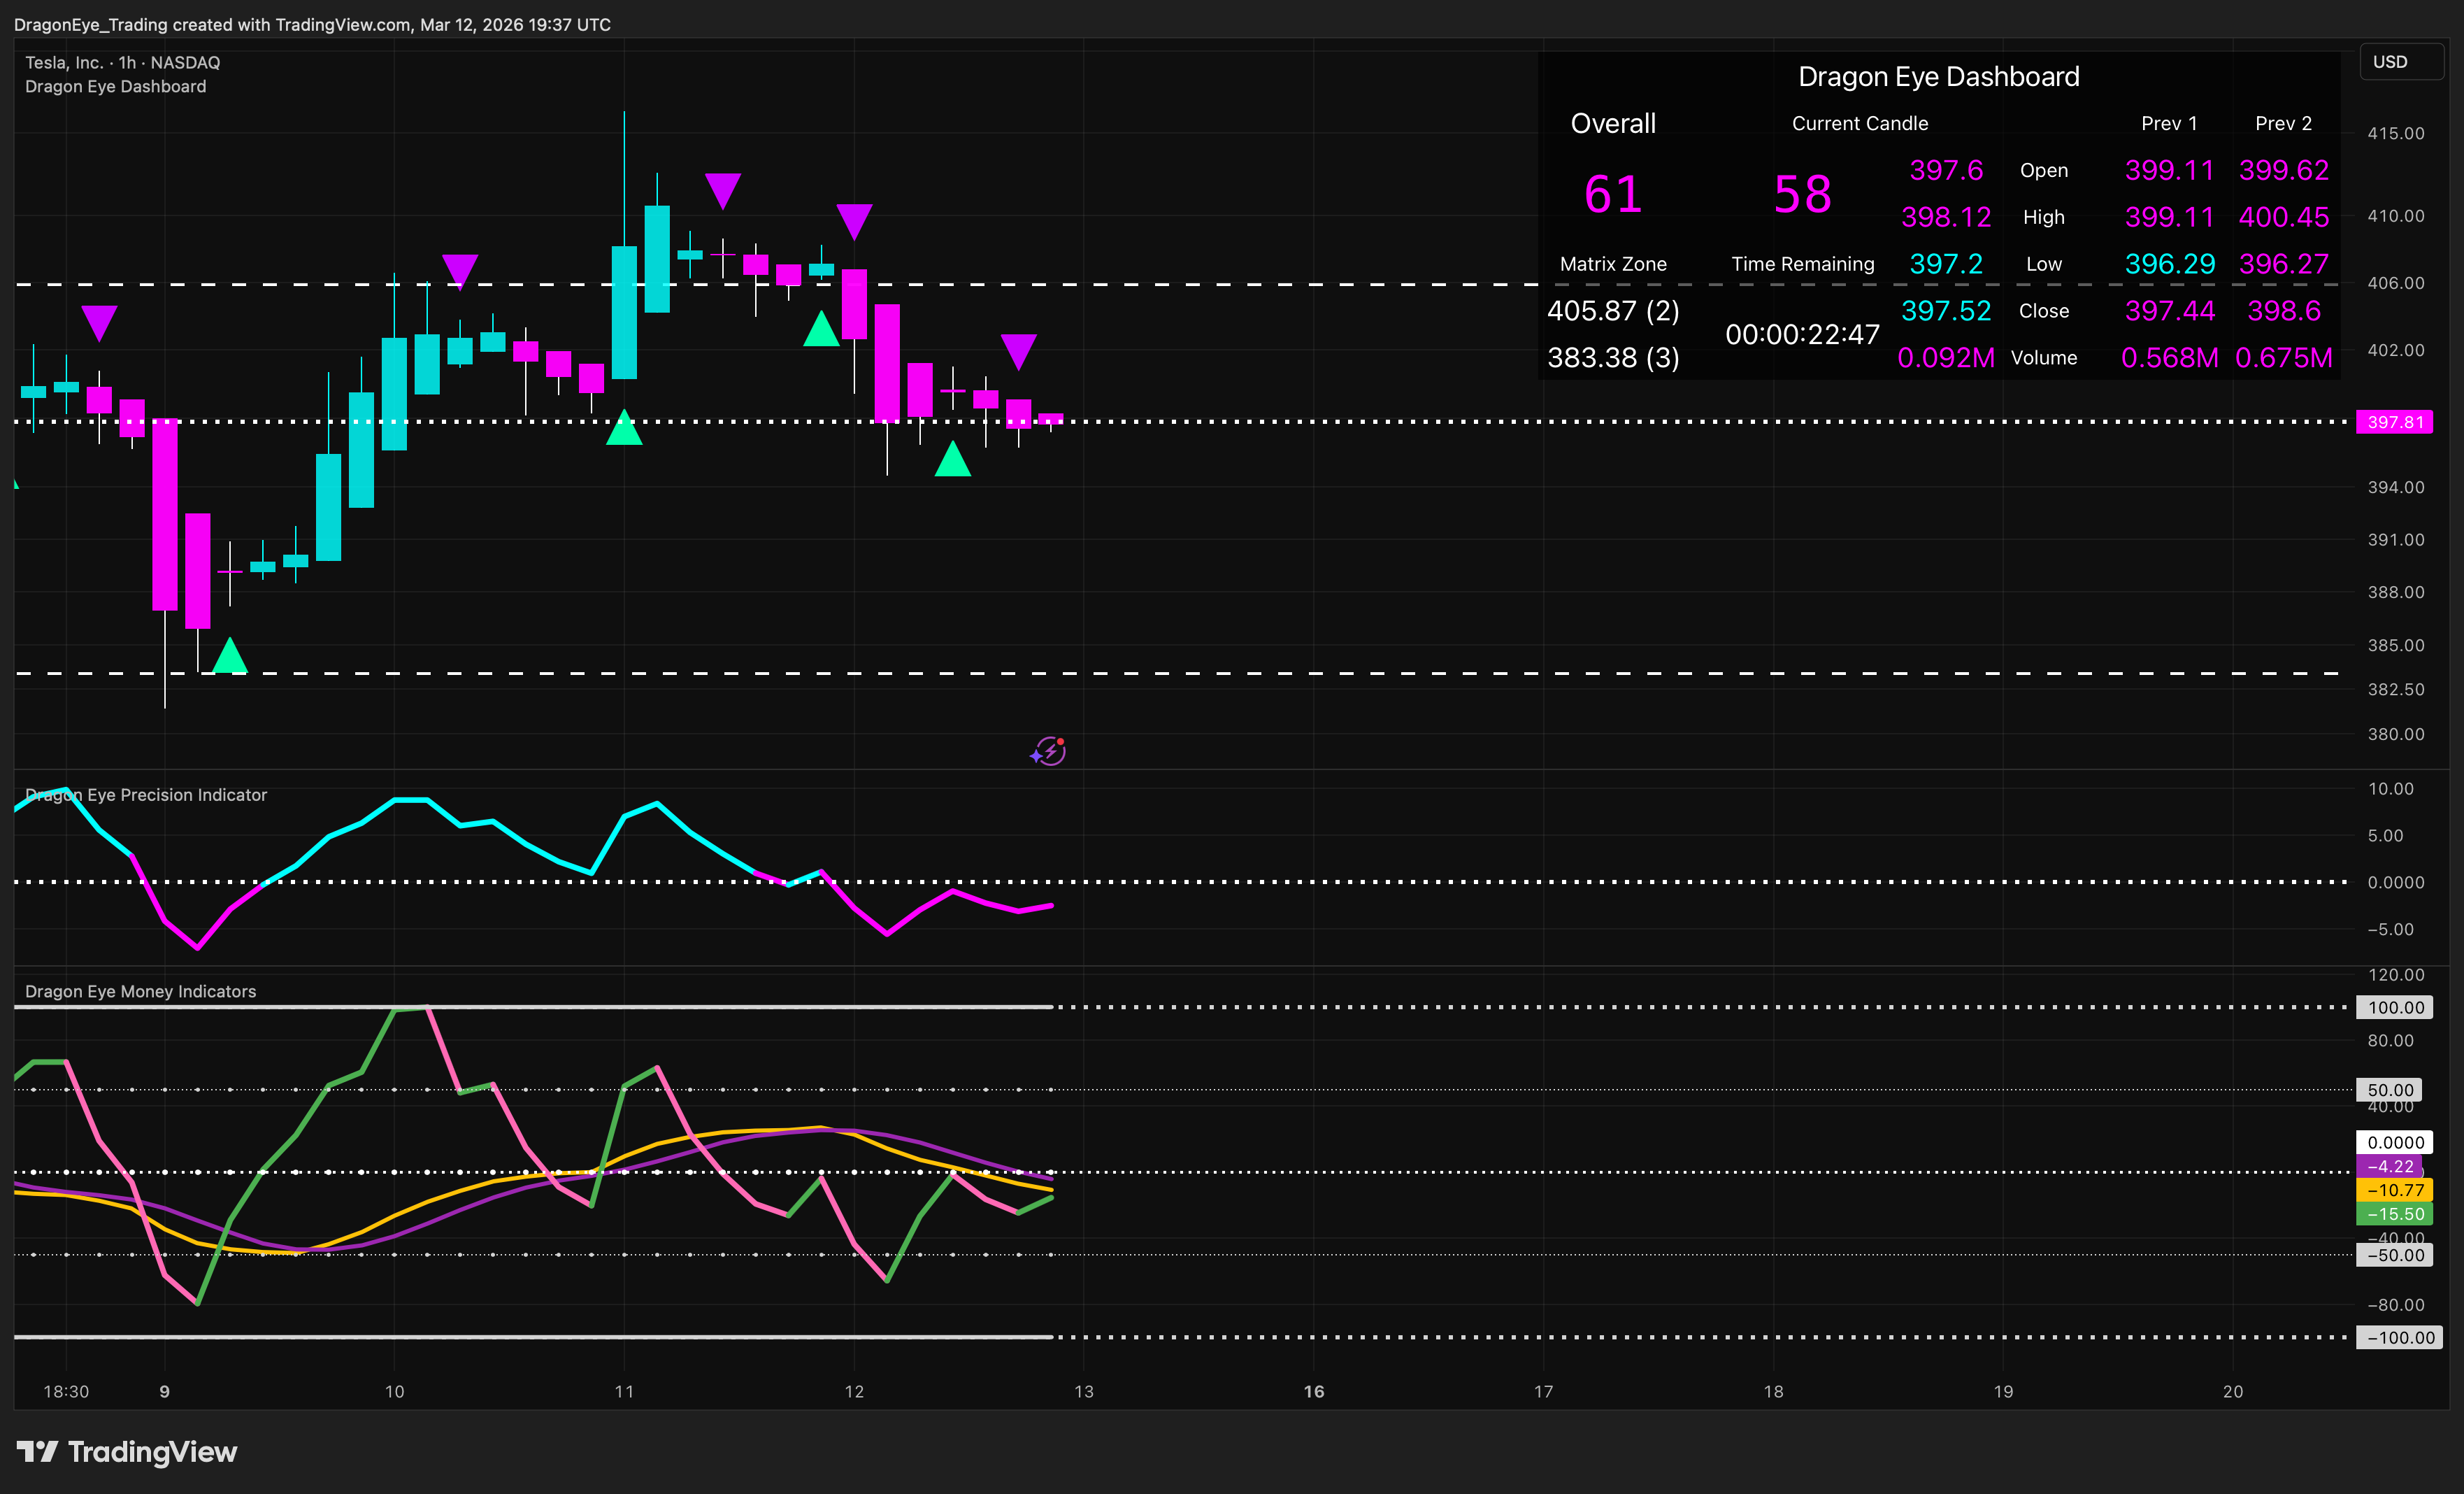
In this TSLA 1-hour chart, the Dragon Eye Suite displayed clear bullish alignment across all components following a sharp reversal shortly after market open. The chart illustrates how the Precision Indicator, Money Indicators, and Dashboard worked together to highlight a strong upward opportunity between the Matrix Zone Rays.

Shortly after the opening bell, the Precision Indicator captured a sharp reversal from bearish to bullish. The cyan line moved decisively above the Bull/Bear Line and maintained a strong upward slope. It remained in a bullish posture throughout the entire move, holding through the short pullback and aligning with the rest of the suite to support the sustained advance to the upper Matrix Zone Ray.
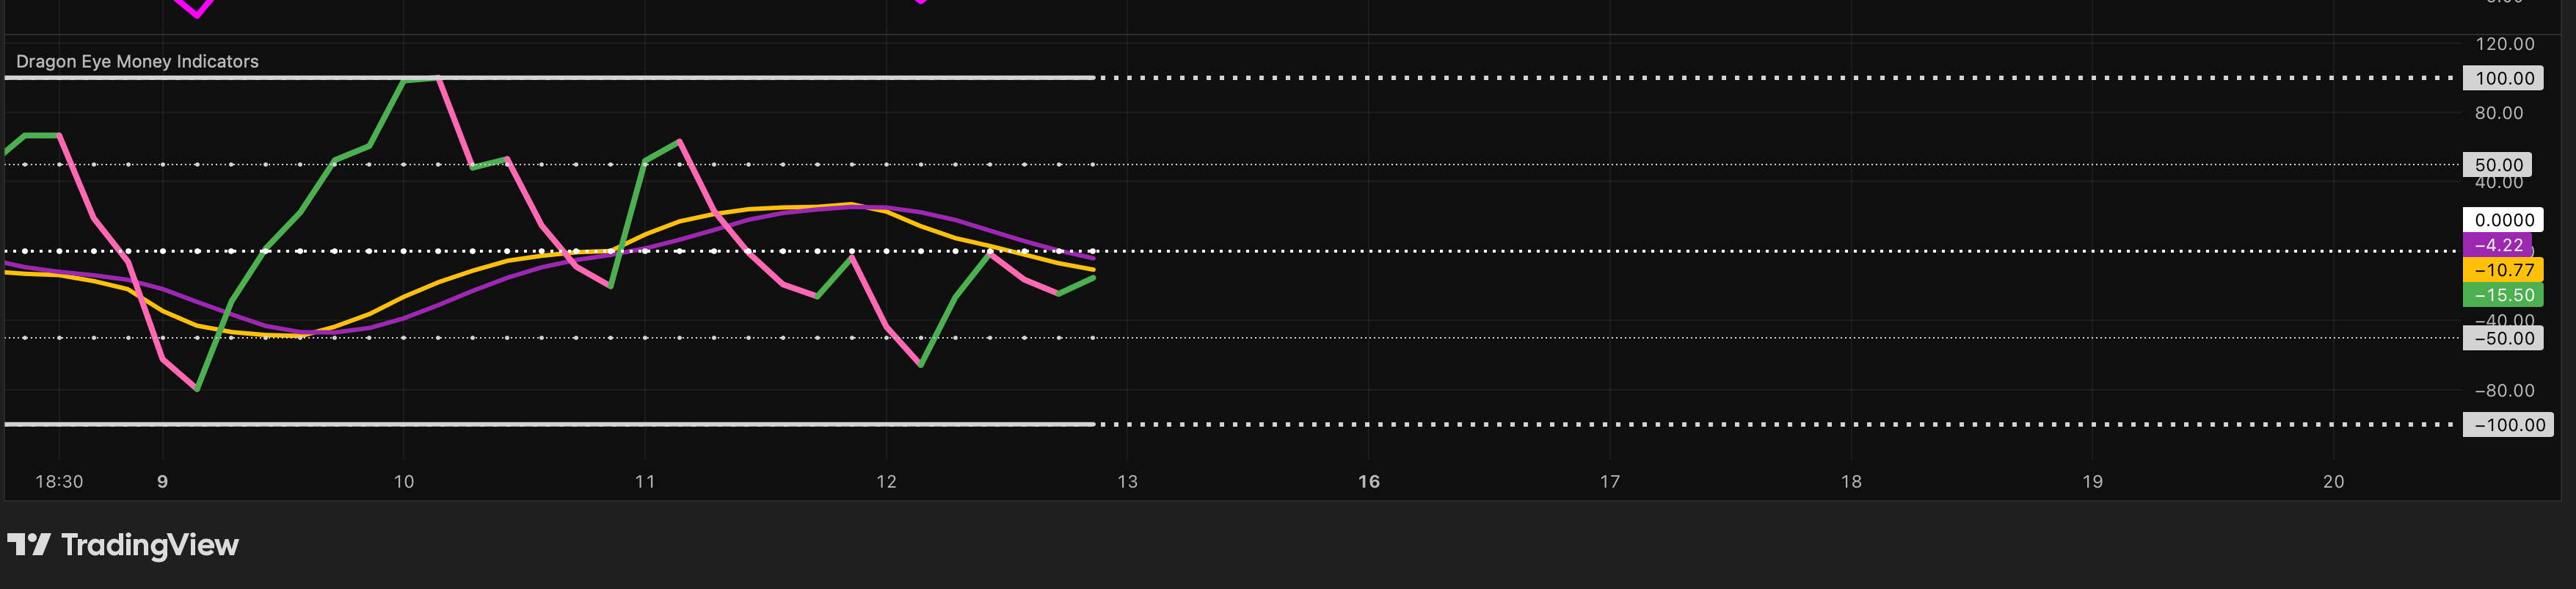
Shortly after market open, the MSI mirrored the Precision Indicator's sharp reversal from bearish to bullish. It turned up into a bullish posture, steadily climbed into clear bullish territory, crossed above the Big Money In Line, and briefly crossed above the topped-out line during the initial advance. It then began to retreat, mirroring the brief pullback in price. Just before it crossed down into bearish territory, the MSI reversed upward again—confirming the move higher.
Just like with the Crypto example, the Price Wave Lines provided final confirmation when the fast yellow momentum line crossed above the slow purple momentum line, signaling the acceleration of bullish momentum before the real move higher occurred.
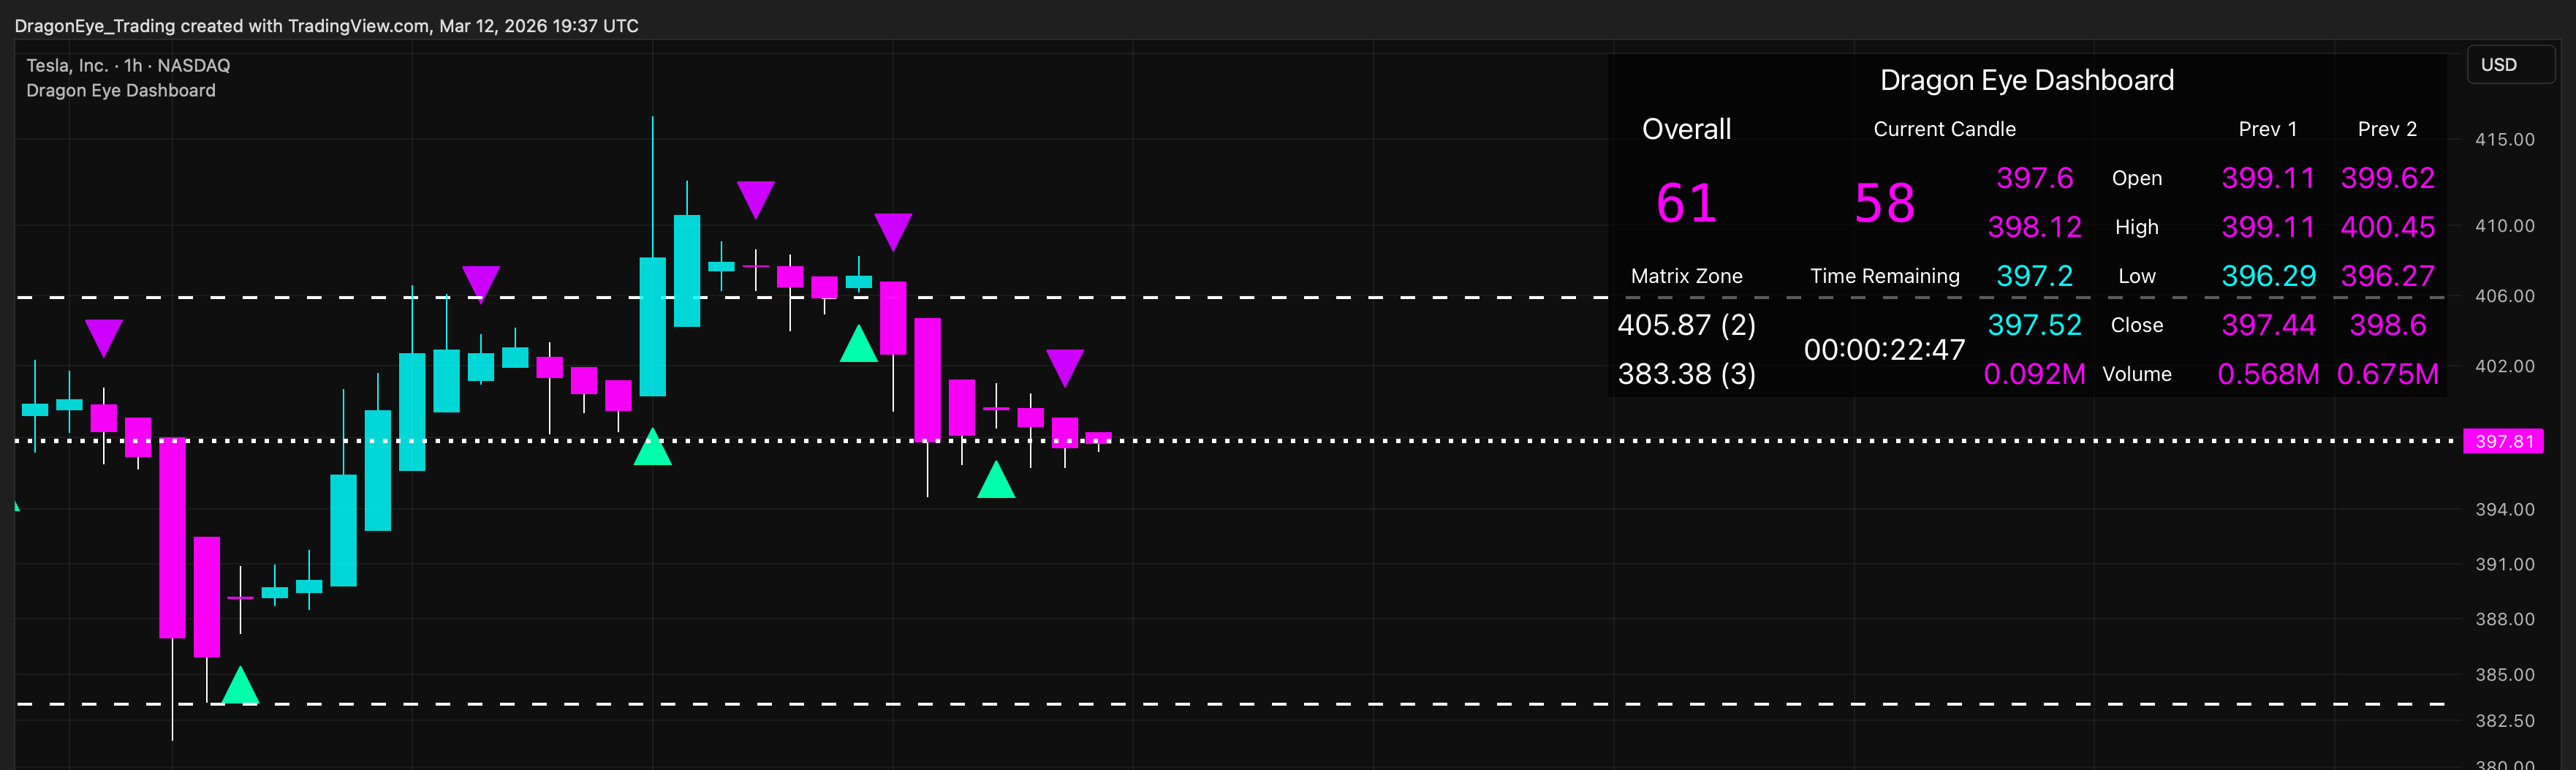
Right at the opening bell, the first upward facing cyan triangle appeared, signaling the sharp reversal to bullish momentum. During the brief pullback, a downward facing magenta triangle helped identify the temporary weakness. As the final move higher developed, another upward facing cyan triangle appeared, confirming the sustained bullish shift.
Just like with the Crypto example, the OHLCV section would have allowed traders to monitor price action and volume momentum in real time alongside the other indicators. The color-coded directional logic across the current and previous two candles provided a clear visual chain of momentum as the setup developed. This helped confirm the sustained bullish move and aligned with the Precision Indicator and Money Indicators.
The Matrix Zone Rays clearly defined the trade boundaries. During the premarket bearish move, price tested the lower MZR as support. After the Pulse Markers, Precision Indicator, and the rest of the suite confirmed the bullish transition, price began its sustained move higher toward the upper MZR.
Just like with the Crypto example, the Dragon Eye Scores helped monitor the bullish trend in both the current candle and the overall market bias. Throughout the setup, the Overall Score remained above 50 and was cyan, while the Current Candle Score continued rising and turned cyan. As the move developed, the rising Current Candle Score provided a single-number confirmation that aligned with the Precision Indicator, Money Indicators, and Matrix Zone Rays.
In this TSLA example, the Dragon Eye Suite showed consistent bullish alignment across all components. The price ultimately rose approximately 5% from the entry zone between the two Matrix Zone Rays, demonstrating how the Precision Indicator, Money Indicators, Dashboard, and Score worked together to highlight the opportunity.
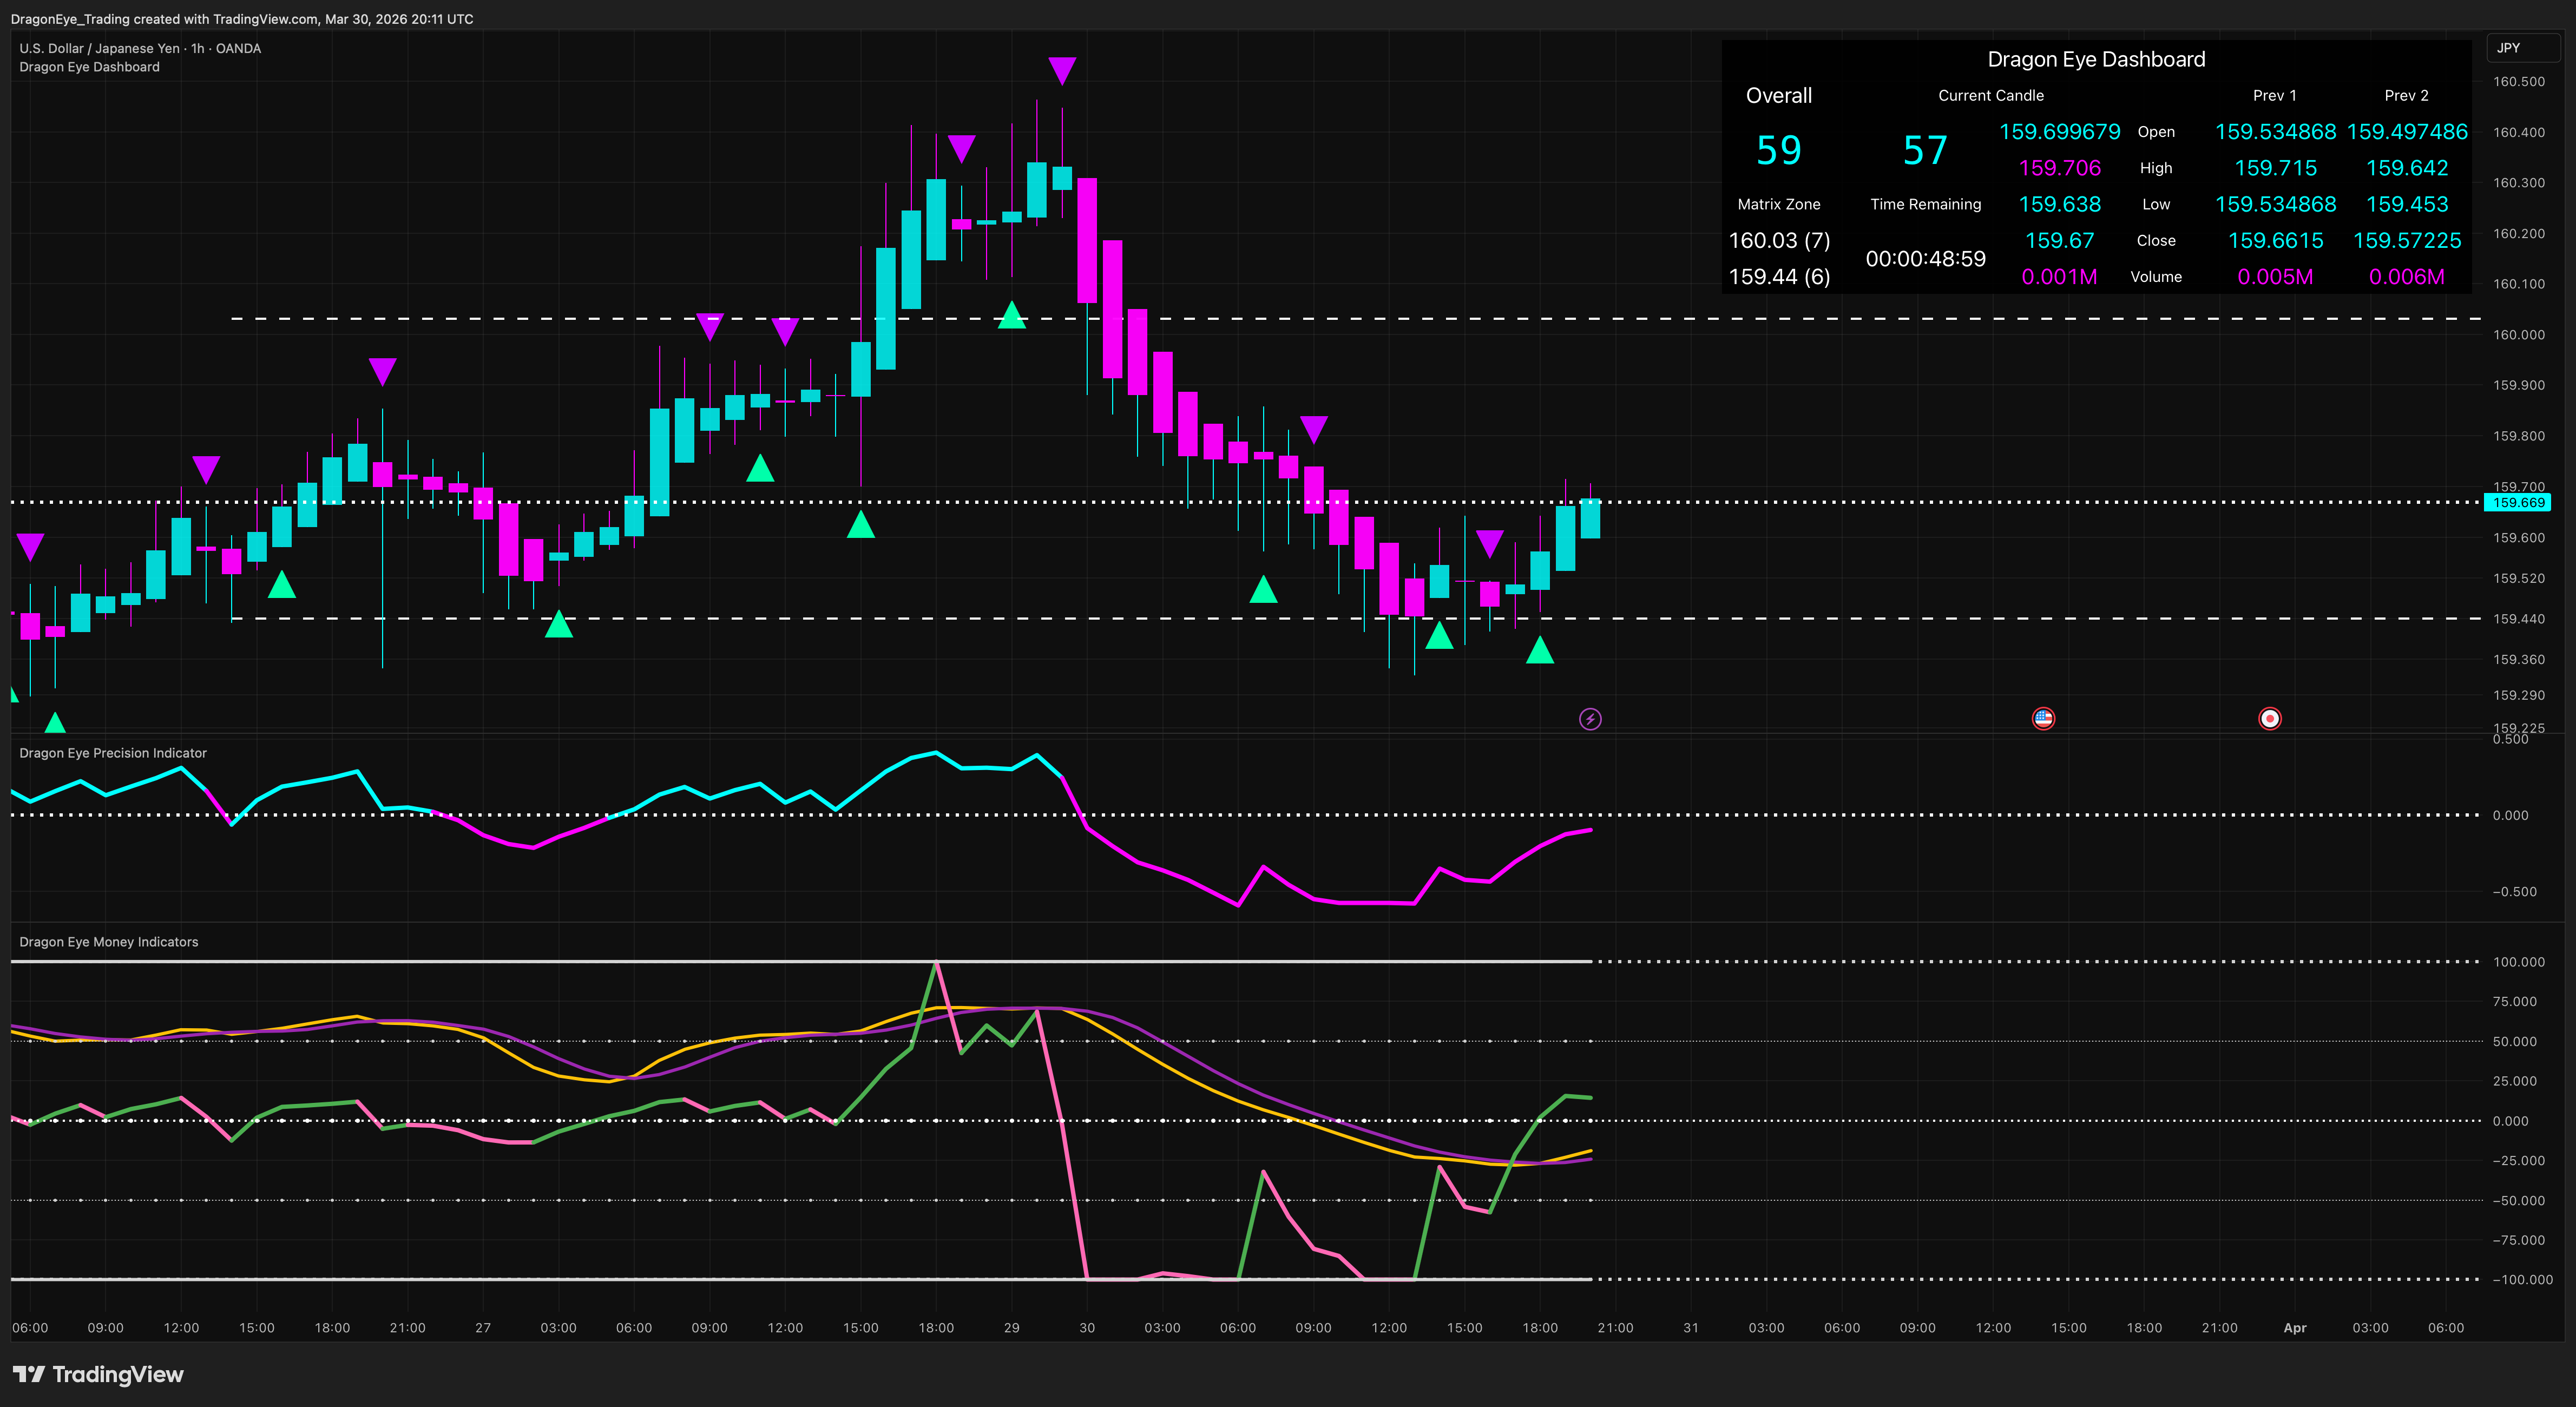
In this USD/JPY 1-hour chart, following a prolonged upward move, the Dragon Eye Suite displayed clear bearish alignment across all components after a sharp reversal shortly after Sunday open. The chart illustrates how the Precision Indicator, Money Indicators, and Dashboard worked together to highlight a strong downward opportunity.

Following a prolonged upward move, the Precision Indicator was still in bullish territory at Sunday open but already showing a weakening downward posture near the Bull/Bear line. Shortly after market open, it turned magenta as it crossed below the Bull/Bear line with a considerable downward slope. This early bearish signal was one of the first indications of the strong liquidity drop that followed and confirmed the reversal into a new bearish phase.
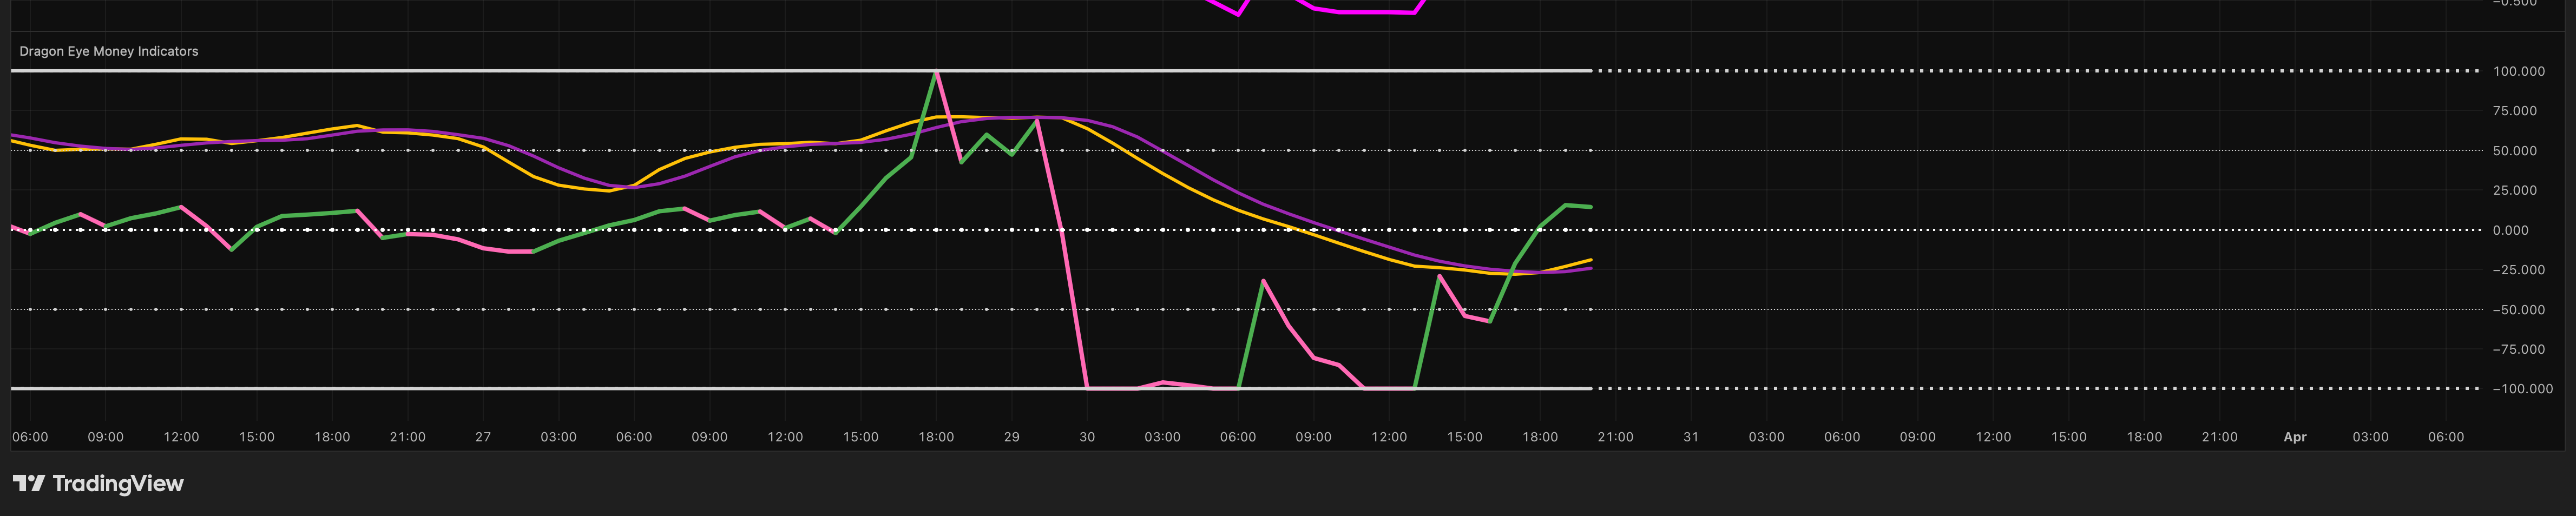
Shortly after market open, the MSI mirrored the Precision Indicator’s reversal with a sharp and aggressive drop. It turned pink, crossed decisively below the Bull/Bear line into bearish territory, continued lower through the Big Money Out line, and reached the Bottom Line. After briefly recovering from the bottomed-out condition, the MSI turned back down and crossed below the Bottom Line again. This renewed decline confirmed the continued strong selling pressure and liquidity outflow driving the bearish cascade.
Prior to the reversal, the Price Wave Lines were positioned above the Big Money In line, helping to signal potential exhaustion in the prolonged upward move. The Price Wave Lines then helped confirm the rapid liquidity drop when the fast yellow momentum line crossed sharply below the slow purple momentum line immediately following the MSI’s rapid decline and color change.
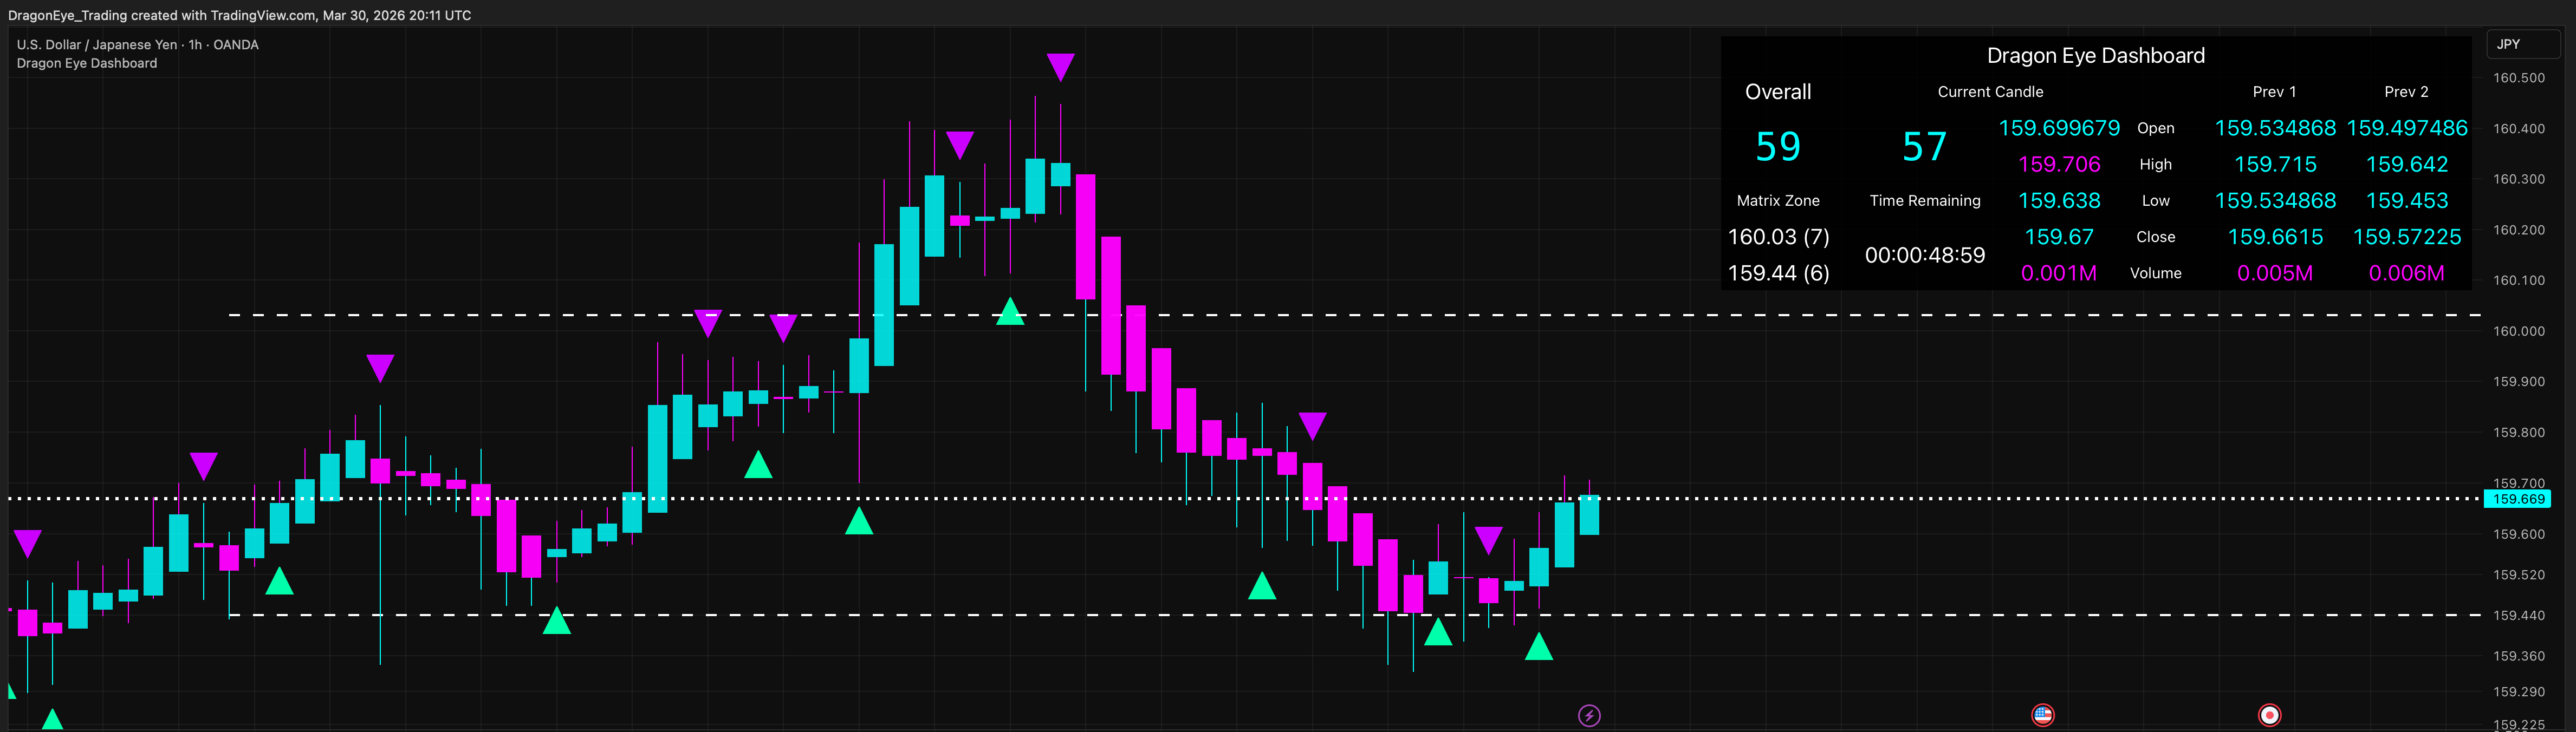
Shortly after market open, the first downward facing magenta triangle appeared on the chart. This Pulse Marker fired just before the Precision Indicator crossed below the Bull/Bear line into bearish territory, providing the initial confirmation of the sharp bearish reversal that followed.
The OHLCV section would have allowed traders to clearly identify the sudden and significant shift in both price direction and volume momentum shortly after market open. The rapid change in color-coded directional logic across the current and previous two candles provided immediate visual confirmation of the strong bearish reversal. As the move continued, this helped confirm the ongoing liquidity outflow and aligned with the Precision Indicator and Money Indicators.
Prior to market open, price had broken above the upper MZR. Once the first downward facing magenta triangle appeared, price started its move to test the MZR as support. Because this was a significant reversal, the MZR failed as support, triggering the rapid cascading move lower toward the next lower MZR.
Before the heavy liquidation began, the Dragon Eye Current Candle Score sat at the higher end of cyan—strongly bullish. As the reversal unfolded, the score rapidly dropped in numbers, crossed into magenta territory, and continued climbing higher in bearish levels. The Overall Score drifted lower—still cyan but weakening—reflecting the size of the move across multiple timeframes. Together, these scores enabled traders to monitor the rapid descent: the Current Candle captured the immediate strength of the reversal, while the Overall’s downward movement confirmed the broader bearish momentum.
The Dragon Eye Trading Suite identified the sharp bearish reversal shortly after Sunday open, well before the heavy liquidation accelerated. In this USD/JPY example, consistent bearish alignment across all components demonstrated how the Precision Indicator, Money Indicators, Dashboard, and Dragon Eye Scores worked together to highlight the strong downward opportunity as price dropped approximately 0.4% between the Matrix Zone Rays.
Ready to access the Dragon Eye Trading Suite? Join now to get started.
Dragon Eye Trading regularly shares additional real-market examples, feature spotlights, and multi-market demonstrations across social platforms leading up to launch.
The Dragon Eye Trading Suite and all information on this website are for educational purposes only and do not constitute financial or investment advice. Trading involves substantial risk, including the potential loss of all capital. Past performance is not indicative of future results. The suite is provided "as is" and results may vary. You are solely responsible for your trading decisions. See our Terms of Service for full details.